School supplies have consumed the seasonal shelves in stores, which means the end of summer is near. While it seems like we just kicked off grilling season, we’ve been busy making improvements to Workbench to make workflows easier and in turn faster. A few highlights of this release include a new date/time picker for investigative actions which defaults to five minutes before and after the vendor alert. We’ve also made it easier to assign remediation actions and for our engagement managers to deliver the most relevant resilience recommendations to your organization.
New
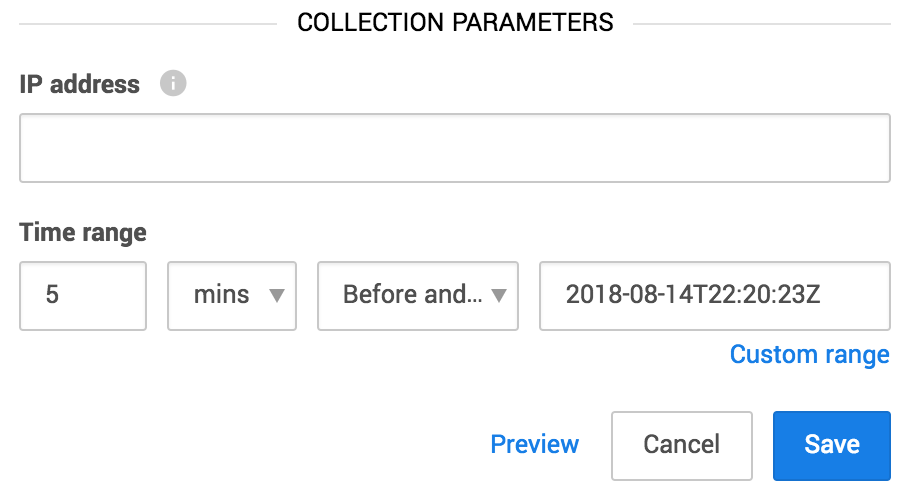
New date/time picker in investigative actions
We’re always looking for ways to make our analysts more productive and improve the Workbench experience. Even small things like a date/time picker can become a source of delight if it’s well designed. We’ve made improvements in the investigative actions to make selecting a time range faster, more accurate, and easier to use. Enjoy!
Enhancements to the resilience dashboard
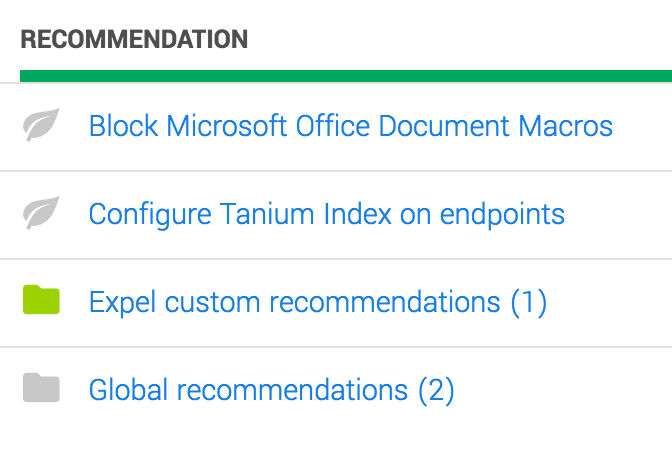
We’ve made a few improvements to the Resilience dashboard so you receive better and more relevant resilience recommendations. Your engagement manager can now:
- Group recommendations — You’ll see this if we have multiple recommendations covering the same topic.
- Customize recommendations — Recommendations with a green icon are custom recommendations specific to your organization.
- Show/hide recommendations — Now you’ll only see recommendations that are relevant to your organization. If you want to see everything, click the View all link.

Better controls for remediation actions
We’ve made it easier for analysts to assign remediation actions. This also means you’ll see more consistent remediation language and formatting. Analysts can now select from a list of the most common remediations actions, including Change passwords for accounts, Delete malicious file, and Remove compromised systems from the network. When a custom remediation action is required, you can still create a custom action.
Other enhancements and integrations
- In the spirit of providing you with answers, not alerts, we’ve put some smarter logic around our notification emails for security device health. Since most device health issues are resolved quickly, we’ll now only notify you when the problem persists for a threshold time period, so you can focus on issues that actually require your attention.
- We’ve added support for Microsoft Azure virtual environment. If you’re interested in adding Azure, contact your engagement manager for more details.
- Expel now supports polled events from Microsoft’s log aggregation and data analytics platform, Azure Log Analytics (ALA). This integration also enables Expel to run investigative queries against ALA data.
- We’ve also added a couple more enrichment sources on the back-end to provide our analysts with more context.
Other fixes (and a few odds and ends)
- We fixed a connectivity issue that occasionally caused Workbench to miss Cb Defense alerts.
- We made some cosmetic improvements to the UI in the Resilience dashboard.
- We improved the display of long filter strings in the Alert Grid.
- Roll call! We changed how the custom time range works in the Alert Grid. Alerts that exactly match the start and end times are now included in the results. Previously, the grid displayed an alert inside the time range.
- Fixed an issue with the Download Installer function that caused a confirmation message to appear before the system had finished downloading.
- Fasten your seatbelt. We fixed a problem that sometimes caused alerts to be ejected from an investigation when two analysts were working on the same investigation.
- We fixed a display issue with the investigation and security incident tiles that caused timestamps to overflow their box at small browser widths.
- Fixed a minor spacing issue with the Investigation summary.
- There was a problem viewing and editing column filters in Data Viewer. This is fixed.
- We corrected an issue in the Alerts Analysis dashboard that caused cloud devices to show as Unhealthy. They now show as not available since, currently, Workbench cannot determine the health of cloud devices. Stay tuned!
- We fixed a problem with the Research button on the Investigative Actions screen that occurred when analysts entered a long string.