
Summer is coming to a close, but our closed reasons are making their debut. In this release, we’ve added more details on why we’ve closed an alert, so it’s easier for you to see a snapshot of closed alert reasons and to dive into the details for a particular alert. While you’re diving in, you’ll find more information about all the steps we took during an investigation on the improved alert history tab.
Alert closed reasons
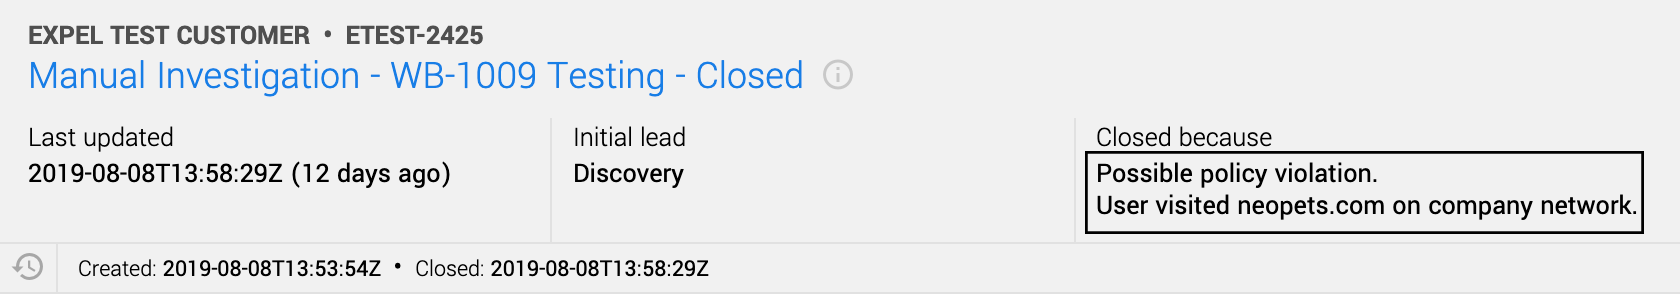
Looking for metrics? We have a new one for you. You’re now able to see more detail on why we closed an alert. For a quick overview, check out the Situation Report to see the closed reasons and count. Or if you’re interested in a particular investigation, check out the investigative tab and find the alert to learn why we closed it out.
Alert history tab
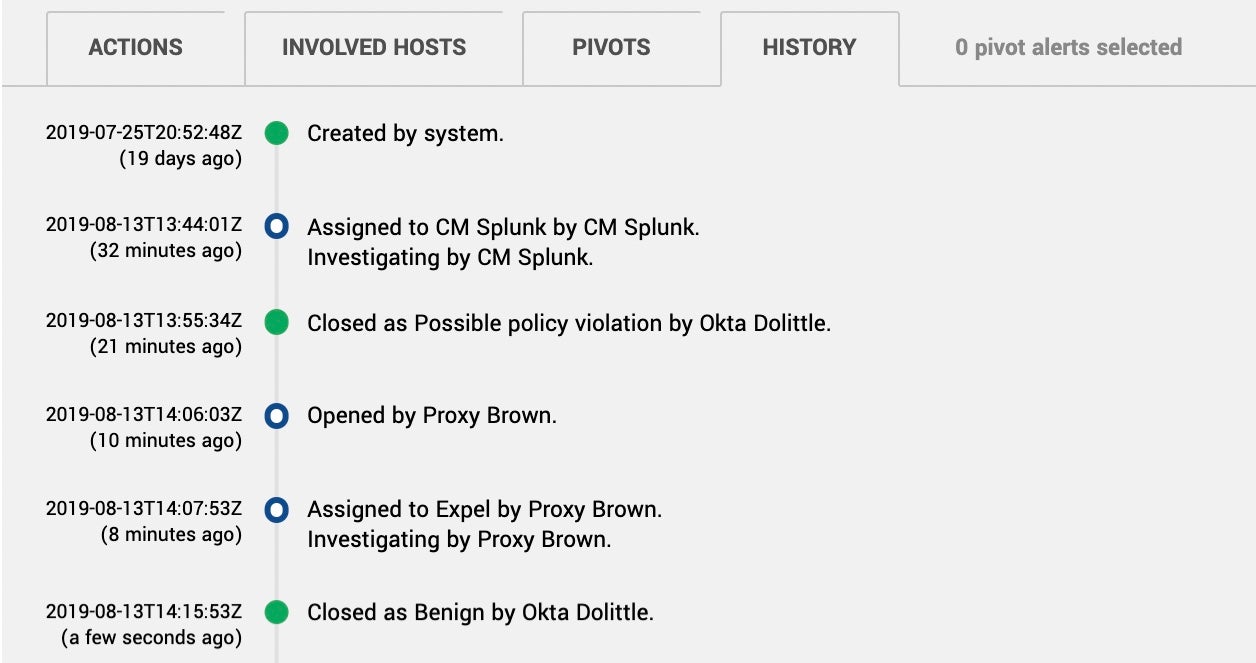
If you’re interested in learning more than just why we closed the alert, check out the Alert Details to see the history of a particular alert.
The new tab shows information like:
- when the alert was created
- if the alert was added to an investigation
- who closed the alert
- why the alert was closed
You can also see the timeline for the creation and completion of remediation and investigative actions on the investigation and incident page.
Other Enhancements
We made styling adjustments to field labels on the Situation Report dashboard to improve the Workbench user experience.
We’ve added the Export CSV feature to the Data Viewer tab.
Ta-da! We’ve added the ability to pivot to the Alerts Grid from the Alert Analysis Dashboard when viewing Expel Alerts. Click the Alert Signature link, and you’ll be redirected to the Alerts Grid with the expected filters set.
We’ve added the ability to re-launch existing investigative actions. To edit the investigative action input fields and re-run that action, click the “Modify query and re-run?” link, update the desired fields, and click the “Save” button.
We’ve added the Alerts CSV Export functionality to the Alert Grid. To use this feature, navigate to the Alerts Grid, set your desired filters, then click the CSV Export icon located on the top-right of the table header. This will create a CSV file that returns results of the filters you’ve set on the grid, allowing for more refined data results.
Other fixes (and a few odds and ends)
- For a brief period, alerts that we were testing appeared in the alerts CSV export. These alerts don’t indicate harmful activity and have been removed from the export.
- If your organization has hunting enabled, the hunting tab briefly disappeared from the Activity page. This issue has been fixed.
- The hint text for our remediation actions took a short vacation, but we’re happy to say it has returned to Workbench.
- We noticed closed investigation tiles weren’t displaying the investigation closed reason, so we’ve fixed this issue.
- Workbench failed to properly display results when attempting to sort alerts on the Alerts Grid by decision, hostnames, or usernames. This issue is now fixed.
- Some of our numbers on the Alert Analysis Dashboard didn’t match up with the data displayed on the graphs. We’ve fixed this issue to improve consistency across the dashboard.
- We fixed an issue that prevented the Investigation CSV Export feature from displaying investigations created by Expel users.
- When accessing the Alert Detail window on the Alert Grid, the window experienced cut-off issues that we’ve now fixed.
- We fixed behavior issues with the Alerts Grid date picker.