
Security operations · 8 MIN READ · TYLER FORNES AND MYLES SATTERFIELD · SEP 1, 2020 · TAGS: Alert / EDR / Get technical / MDR / SIEM
It’s no secret that the industry has eyes for Defender for Endpoint. After a few months of using and integrating it with our platform, we feel the same.
In a few other posts, we’ve shared our thought process on how we think about security operations at scale and the decision support we provide our analysts through our robots. In short, Defender for Endpoint made it really easy for us to get to our standard of investigative quality and response time without requiring the heavy lift to get the features we needed upfront.
So what is Microsoft Defender for Endpoint?
Microsoft Defender for Endpoint is an enterprise endpoint security product that supports Mac, Linux and Windows operating systems. There are a ton of cool things that Defender for Endpoint does at an administrative level (such as attack surface reduction and configurable remediation) however from our vantage point, we know it best for its detection and response capabilities.
Defender for Endpoint is unique because not only does it combine an EDR and anti-virus (AV) detection engine into the same product, but for Windows 10 hosts this functionality is built into the operating system (removing the need to install an endpoint agent). With an appropriate Microsoft license, Defender for Endpoint and Windows 10 provide out of the box protection without the need to mass-deploy software or provision sensors across your fleet.
What is EDR and how do these tools help us
When we integrate with an endpoint detection and response (EDR) product, our goal is to predict the investigative questions that an analyst is going to ask and then have the robot perform the action of getting the necessary data from that tool. This frees up our analyst to make the decision. We think Defender for Endpoint provides the right toolset for helping us easily reach that goal via its API.
Why Microsoft Defender for Endpoint is the best
Thanks to Defender for Endpoint’s robust APIs, we augmented its capability to provide upfront decision support to our analysts that arms them with the answers to the basic investigative questions that we ask ourselves with every alert.
To find these answers, there’s a few specific capabilities of Defender for Endpoint that we tap into that allow us to pull this information into each alert. This way, our analysts don’t need to worry about using the tool, but instead, get to focus on analyzing the rich data that it provides:
- Advanced hunting database
- Prevalence information
- Detailed process logging
- AV actions
Like we mentioned, Defender for Endpoint is an amazing investigative tool out of the box, but it only gets better once you start peeking under the hood. Our favorite for Endpoint feature? The API.
Here at Expel, robots are our friends. They help us with decision support. This is what enables our analysts to focus on making decisions rather than worrying about how to use 30+ different technologies to gather the data we need to answer investigative questions. To be effective, our robots must not only be good at collecting the data needed but preparing it for interpretation as well. Therefore our robots aren’t just good at collecting data, they also translate it into a format our analysts can easily work with and is consistent across multiple technologies.
With Defender’s rich API, we have an opportunity to replicate the manual scoping actions our analysts would take in the console and perform them automatically in our own platform.
Now that we’ve written our love letter to Defender for Endpoint, we’ll show you a real example of how we use this tool to triage an alert.
Triaging an alert using Microsoft Defender for Endpoint
First things first: here’s how we break down an alert.
At a high level, we’re looking to answer five basic investigative questions:
- What is it?
- Where is it?
- How did we detect it?
- How did it get there?
- When did it get there?
Defender for Endpoint’s features help us easily answer these questions.
Here’s an example of what a Defender for Endpoint alert looks like when it initially comes through the Expel Workbench:
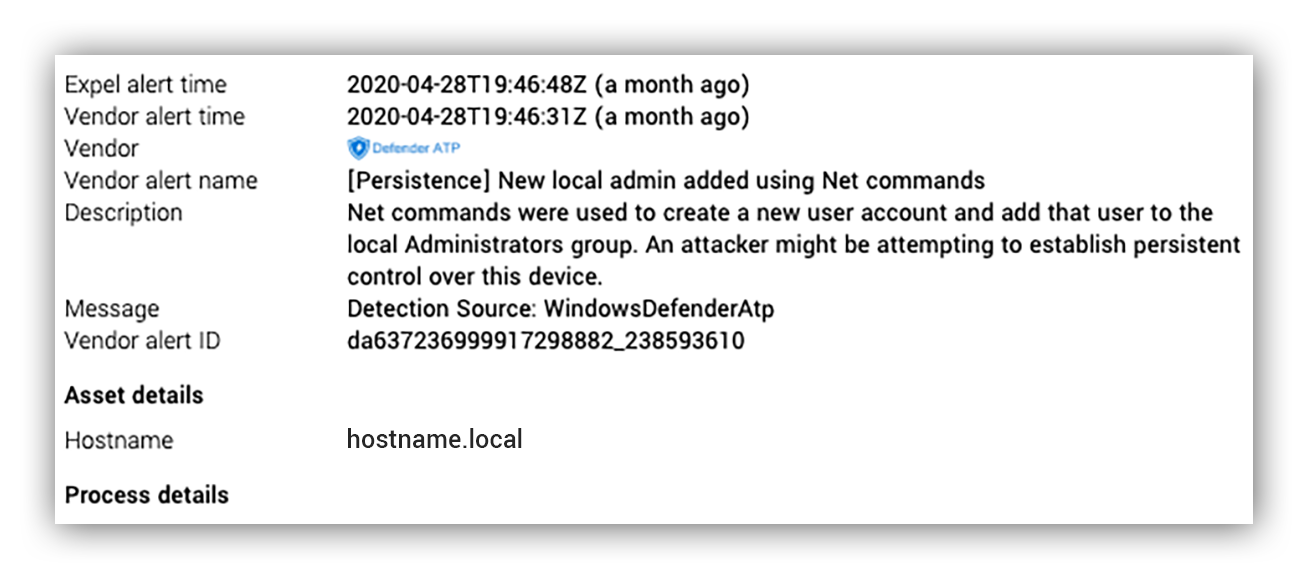
Initial lead of suspicious commands
Here’s what we know
What is it?
- Suspicious net commands being run by this user
Where is it?
- One host
How did we detect it?
- EDR alert – execution of suspicious commands
What we don’t know, how and when did it get here
Now to answer the money questions. We need to ask ourselves the last two of our investigative questions (How did it get there? When did it get there?) to understand how we will need to proceed in our investigation. And, as with any investigation, they will require additional data to answer.
An analyst’s measure of a good EDR platform will always be biased towards whether or not the data they need is available, easy to obtain and to understand. In our experience, Defender for Endpoint does an excellent job of anticipating these questions and providing easy access to detailed process information that allows an analyst to quickly and confidently make decisions.
To highlight this, let’s attempt to answer How did it get there? using some of the data provided to us with the Defender for Endpoint alert.
Our favorite way to answer this? The Alert Process tree.
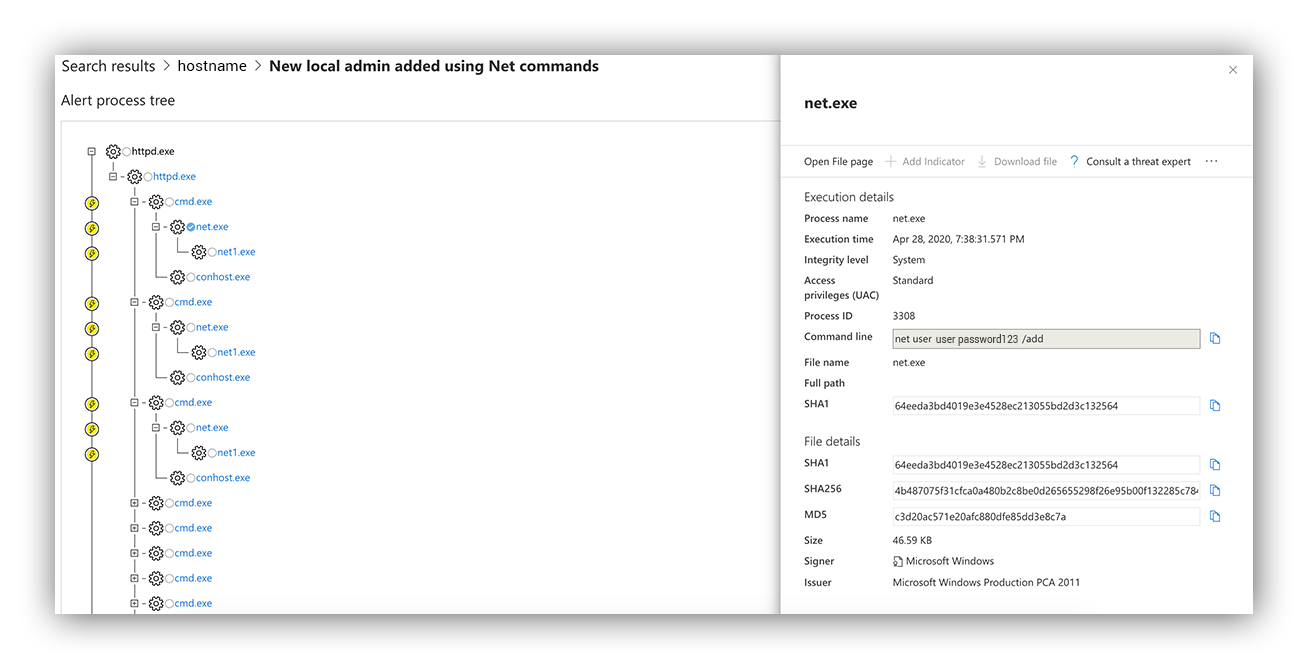
Process tree of activity flagged in the alert
As analysts, we love to see a nice process tree (like the one you see above). Being able to visualize the lineage of a process is extremely helpful, especially when time is of the essence. Defender for Endpoint presents us with a detailed hierarchy of the processes involved in an alert, marking anything it believes to be suspicious with a yellow lightning bolt.
By looking at the process tree, we can easily identify that the suspicious net commands spawned from the parent process “httpd.exe.”
Why is this detail relevant?
This is common behavior associated with webshells from a remote attacker. By knowing this, we now have evidence to suggest an anomalous process relationship and likely an incident.
With a suspected webshell on the brain, now we have a little bit of clarity on how these suspicious commands were executed. But two important questions still remain:
- How did this webshell get here?
- When did the webshell first enter the environment?
Again, these are high-level questions and an experienced analyst is naturally going to attempt to identify the sources and frequency of the webshell interaction as well. But regardless, the Timeline feature of the Incident pane allows us to answer all of these.
Check out this output when we search for the process “httpd.exe” on the alerted host.
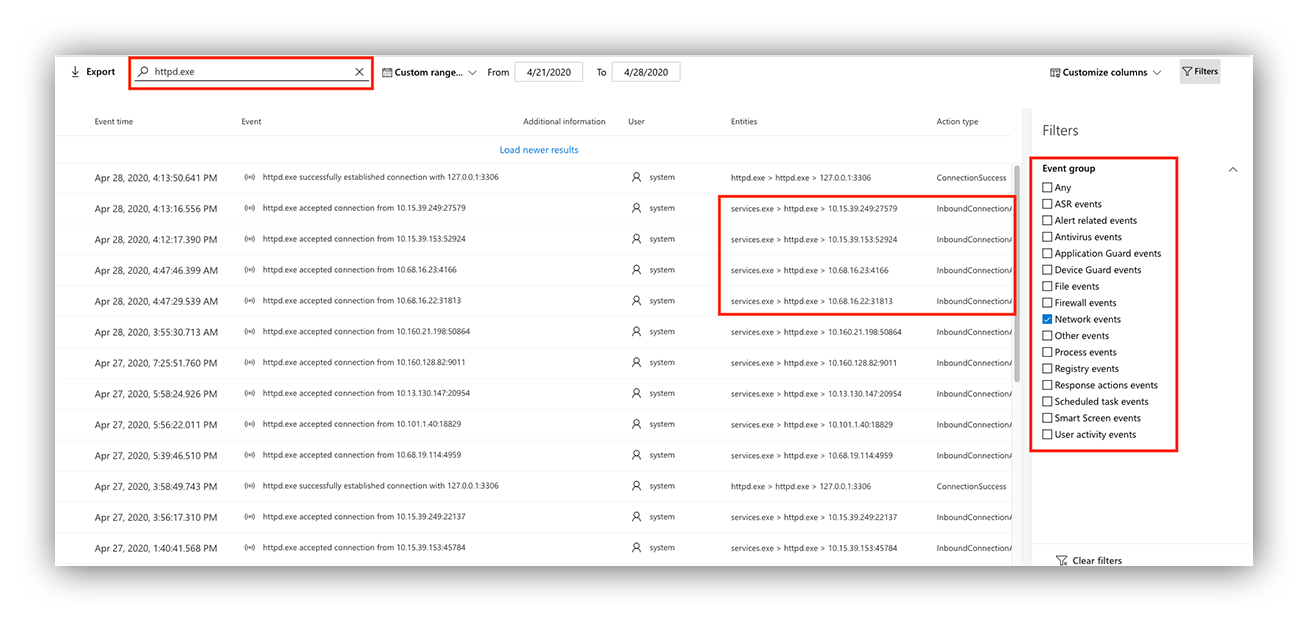
Timeline view to filter network connections from the httpd.exe process
We can answer When did it get there? by filtering network connections, helping us clearly identify network connections related to the suspicious “httpd.exe” activity and determining the time they first started.
More than likely, these connections are the Command and Control we would expect from webshell interaction; containing the “net” commands that we were alerted to initially.
Seeing the whole picture
With just a few tools in the Defender for Endpoint console, we can easily scope this activity and answer all five of our initial investigative questions.
What is it?
- Reconnaissance commands being executed by an attacker
Where is it?
- One host (Web application host)
How did we detect it?
- EDR alert – execution of suspicious commands
How did it get there?
- A webshell deployed through an application vulnerability
When did it get there?
- A few hours prior to our original alert
How do we use Defender’s features to our advantage?
If you asked a robot what it’s job at Expel is, it would likely respond in a JSON blob. JSON is great for transferring and formatting data in an efficient way, but it’s not great for a human to read.
Therefore outside of just collecting the data, our robots are also responsible for making this data ready for interpretation by an analyst in a format that is readable and consistent.
So how do our robots pull this off?
Well, our robots speak API. It all starts with them being able to ask some very simple questions of Defender for Endpoint.
We’ve found that Defender for Endpoint has a rich API that allows us to automate our entire triage process.
Let’s take a look at what this looks like with our lead alert.
Defender for Endpoint Alert decision support
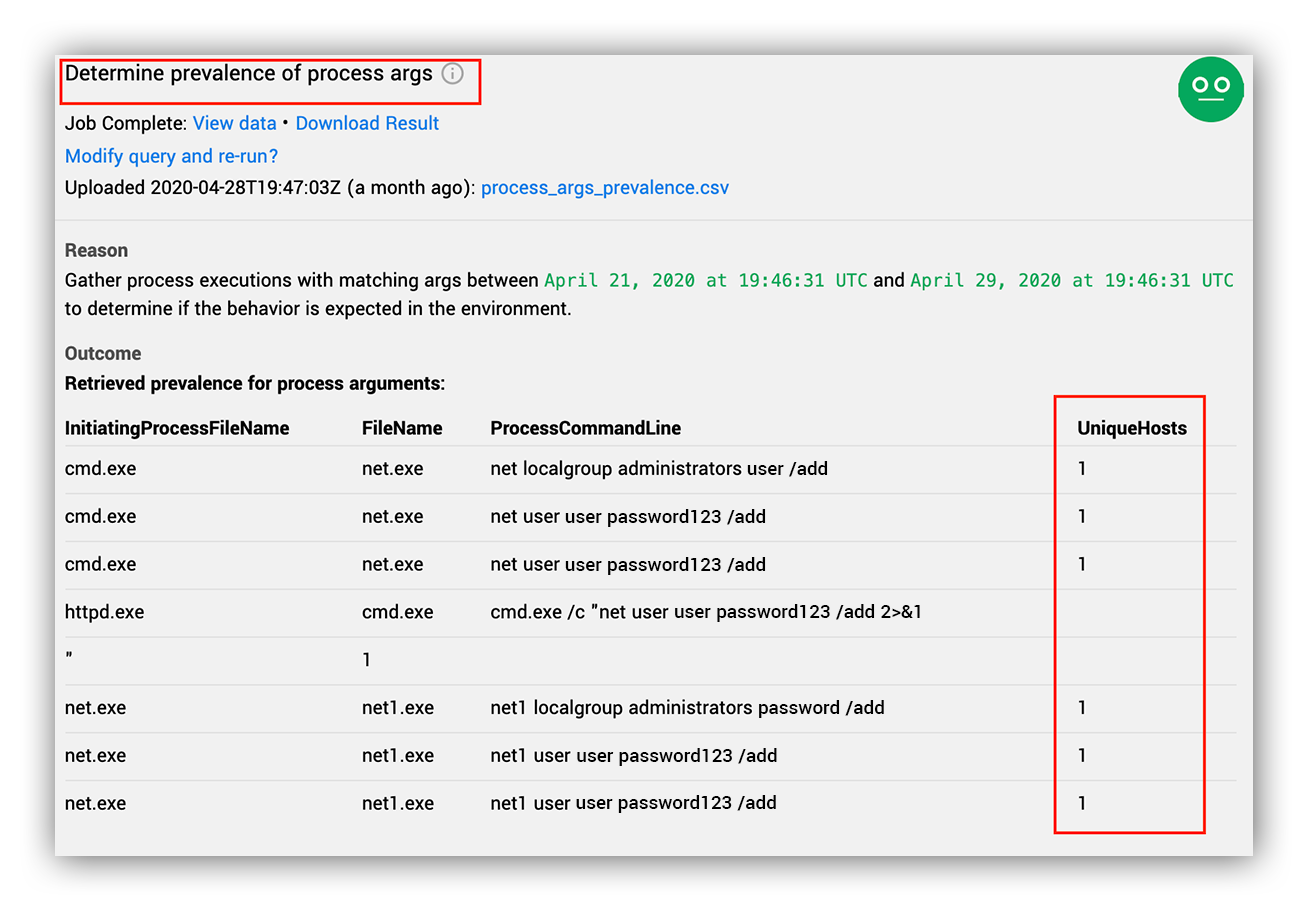
Prevalence Information
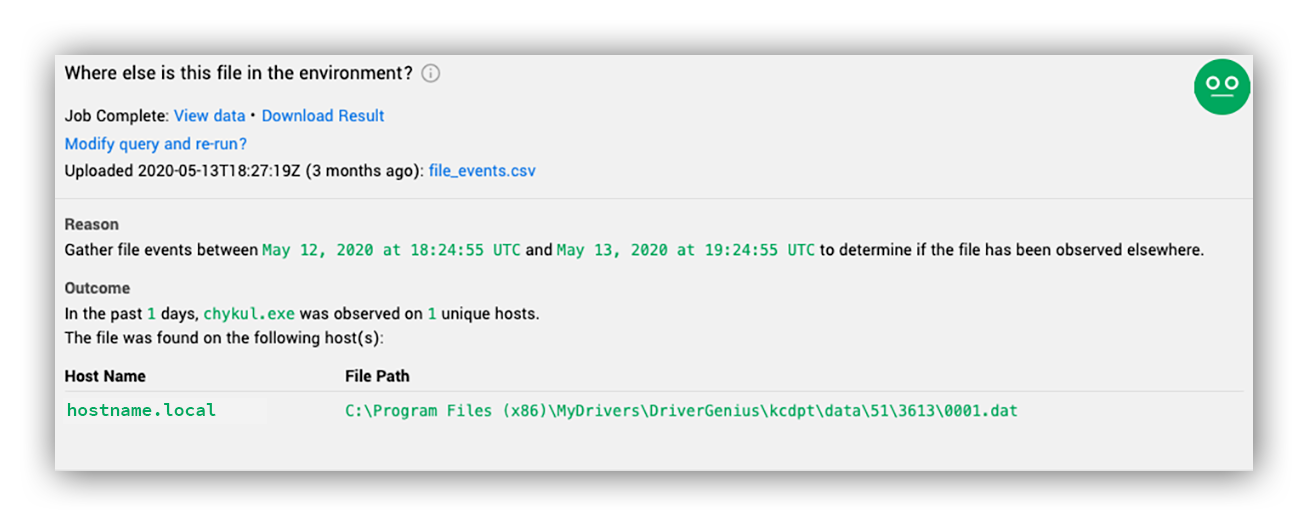
Where is it?
As an analyst, this is probably one of the first (and most powerful) questions you can ask yourself in an investigation. The lower the prevalence, the more likely you’re looking at something out of place. The way we do this with Defender for Endpoint is by normalizing the process arguments that were alerted on, and query for them in the Advanced Hunting Database.
As you can see above, our analysts immediately know that in the past seven days these commands are completely unique compared to the one host we’re already investigating. We can see this by looking at how common these process arguments are in the environment.
We also do this with the normalized file path to help identify whether or not the alerted activity is being executed out of an abnormal location, or is simply a commonly installed binary in the environment by showing us everywhere the file is seen. With this information we can easily spot legitimate binaries in abnormal locations, or spoofed binaries that are executing out of legitimate directories.
Defender for Endpoint Alert decision support
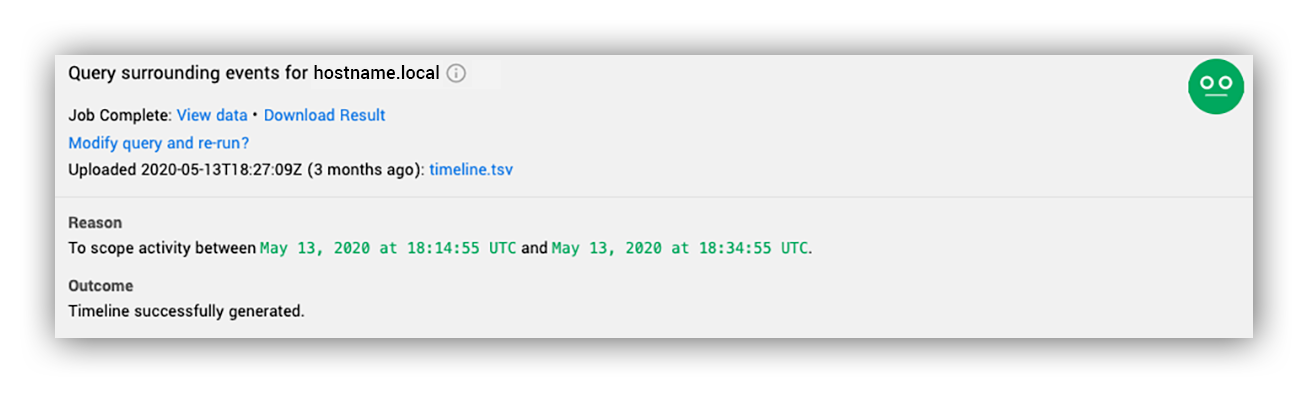
Auto-Timeline Generation
Your next logical question as an analyst is usually: How did it get there? We anticipate this and provide a timeline of the activity that occurred in a five minute window around the time of the alert. Since this comes with the alert, there’s no wasting time learning a query language, logging into the console, waiting for the query to run and parsing the data. All in all, we save at least five to 10 minutes per alert when this data is retrieved and interpreted by our robot.
This data comes back in a normalized CSV format so an analyst can easily open and filter that data in Excel.
Below, you’ll see an example of an automatic timeline generated for the host involved in the alert.
Defender for Endpoint Decision support
Our Timeline format is very simple, and emulates the format in which we keep our master incident Timelines. That way we can easily take data from multiple sources and combine them into a master Timeline that tracks an incident across multiple hosts, users and organizations (note that columns are redacted).
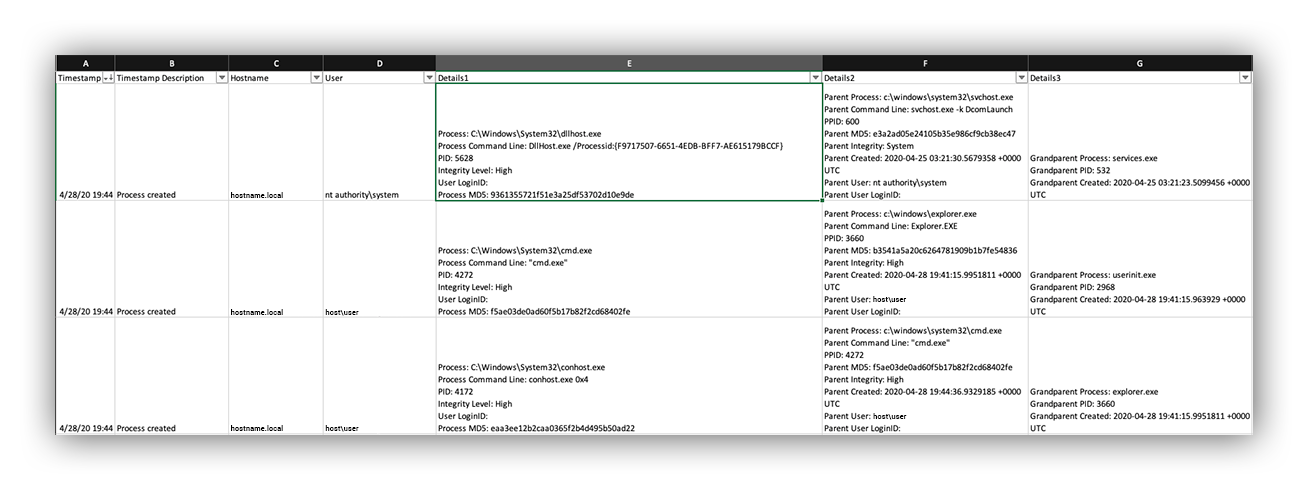
Timeline acquired through our robots in CSV format
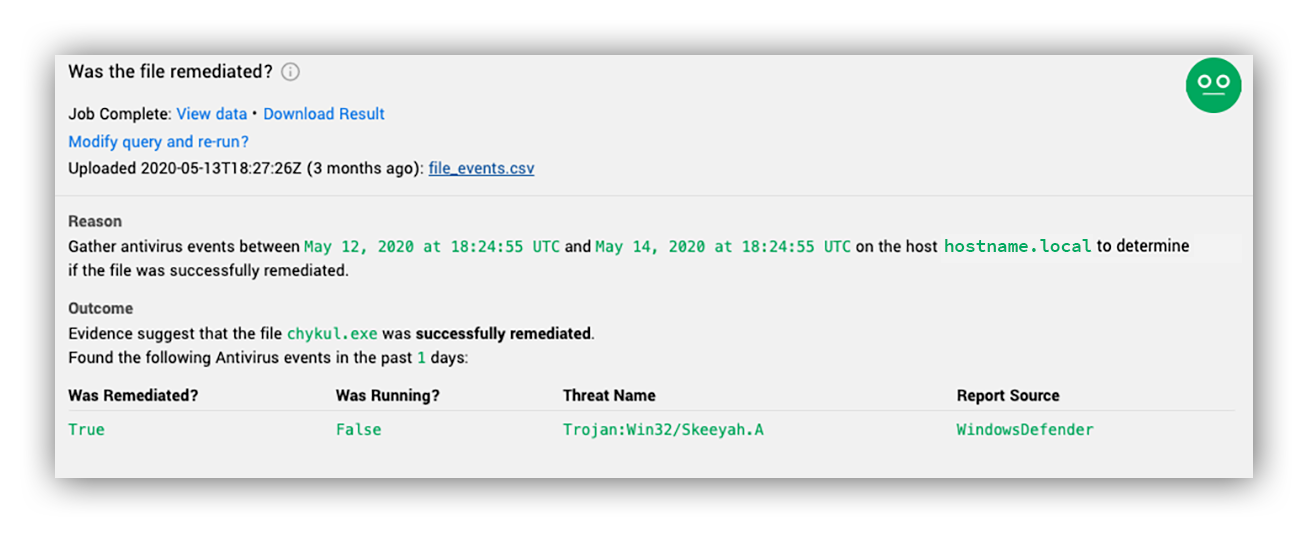
AV Actions
One of the greatest features of Defender for Endpoint is its configurable remediation policies. As defenders we usually want to know pretty early on whether or not a specific file was allowed to execute, or was blocked/ended by Defender for Endpoint at runtime. Our robots reach out to get us that context on each alert, and alert us to what Defender for Endpoint action was applied to the suspicious activity (if any) so that we can make smarter decisions about our response. For example, no one wants to spin up an incident for a blocked stage one download, but if the second stage was allowed to execute – let’s call in the troops.
In the example below we see that a file matching a signature for the Skeeyah trojan was identified and blocked at runtime. Before having to prove execution, we now know the scope is limited to simply answering one question (How did it get here?) rather than a bunch of post-exploitation questions right off the bat:
- What other actions happened as a result?
- What C2 did it communicate with?
- How many other machines are infected?
We save a lot of time knowing this up front as there is no ambiguity on the action taken by the tool or having to parse detailed logs to find this information.
Defender for Endpoint Decision Support
Putting it all Together
The decision support Defender for Endpoint enables us to generate is powerful because it allows us to become specialists at analysis rather than specialists of a specific technology.
Don’t get us wrong, there are always benefits to knowing the tool. But a carpenter building a house isn’t usually the same person who forged the hammer. Decision support allows us to be flexible in the tools that we’re using but also to be consistent in the response we provide to our customers.
By standardizing the investigative questions and building our robots to answer those questions automatically, we can uplevel the capability of our analysts. Defender for Endpoint provides a platform that allows our analysts to quickly and accurately answer important questions during an investigation. But most importantly, having these capabilities emulated in the API allowed us to build on top of the Defender for Endpoint platform to be more efficient in our goal of providing high-quality detection and response across multiple organizations.
Have questions? Let’s chat.


