
Engineering · 8 MIN READ · DAVID BLEWETT · FEB 23, 2021 · TAGS: Cloud security / MDR / Tech tools
Running a 24×7 managed detection and response (MDR) service means you don’t have the luxury of scheduling downtime to upgrade or test pieces of critical infrastructure.
If that doesn’t sound challenging enough, we recently realized we needed to make some structural changes to one the most important components of our infrastructure – Expel’s data pipeline, and the processing of that data pipeline.
Our mission was to migrate from a virtual machine (VM)-based deployment to a container-based deployment. With zero downtime.
How did we pull it off?
I’m going to tell you in this blog post.
If you’re interested in learning how to combine Kubernetes, feature flags and metric-driven deployments, keep reading.
Background: Josie™ and the Expel Workbench™
In the past year at Expel, we’ve migrated to Kubernetes as our core engineering platform (AKA the thing that enables us to run the Expel Workbench).
What’s the Expel Workbench?
It’s the platform we built so that our analysts can quickly get all the info they need about an alert and make quick decisions on what action to take next. In addition to some other very cool things.
Back to Kubernetes.
While known for its complexity (who here likes YAML?), Kubernetes comes with a large amount of functionality that can, if used correctly, result in elegant solutions.
 Full disclosure: I’m not going to dive into all the things we do with Kubernetes, or what is Kubernetes for that matter. Instead, I’m going to focus specifically on our data pipeline and detection engine (we call her Josie).
Our detection pipeline receives events (or logs) and alerts from our customer’s devices and cloud environments. Then, our detection engine processes each alert and decides what to do with it.
We have some fundamental beliefs about detection content and our pipeline:
- Never lose an alert;
- Quality and scale aren’t mutually exclusive;
- The best ideas come from those closest to the problem; and
- Engineering builds frameworks for others to supply content.
This means our detection pipeline is content-driven and can be updated by our SOC analysts here at Expel. We also hold the opinion that content should never take a framework down. If it does, that’s on engineering, not the content authors.
With these beliefs in mind, we were faced with the challenge of making structural changes to how we are running our detection engine, ensuring quality, not losing alerts and still enabling analysts to drive the content.
Josie’s journey to Kubernetes
What we knew
Ensuring this migration didn’t disrupt the daily workflow of the SOC was key.
Just as important was not polluting metrics used for tracking the performance of the SOC.
That’s why we wanted an iterative process. We wanted to run both pipelines in parallel and compare all the performance metrics and output to ensure parity.
We also knew we wanted to be able to dynamically route traffic between pipelines, without the need for code-level changes requiring a build and deploy cycle. This would allow us to automatically re-route and have that change effective as quickly as possible.
The final requirement was to retain the automated delivery of rule content. While the existing mechanism was error-prone, we didn’t want to take a step backward here.
Tech we chose
We were already moving our production infrastructure to Kubernetes. So we took full advantage of several primitives in Kubernetes, including Deployments, ConfigMaps and controllers.
We chose LaunchDarkly as a feature flag platform to solve both the testing in production and routing requirements.
Their user interface (UI) is the icing on the cake – tracking changes in feature flag configuration as well as tracking flag usage over time. The real-time messaging built into their software development kit (SDK) enabled us to propagate flag changes on the order of hundreds of milliseconds.
Preparing Josie for her journey
If you’ve read our other blogs, you’ll know that Expel is data-driven when it comes to decision making.
We rely on dashboards and monitors in DataDog to keep track of what’s happening in our running systems on a real-time basis. Introducing a parallel pipeline carries the risk of polluting dashboards by artificially inflating counts. To mitigate this, we added tags to our custom metrics in DataDog.
After the new tag was populated by the existing pipeline, we added a simple template variable, defaulting to filter to the current rule engine.
This ensured that existing users’ view of the world was scoped to the original engine. It also enabled the team to compare performance between the parallel pipelines in a very granular way.
We then updated monitors to include the new tag, so they alerted separately from the old engine.
The next step was to add gates to the application that would allow us to dynamically shift traffic between rule engines.
To do this, we created two feature flags in LaunchDarkly: one to control data that is allowed into a rule engine and one to control what is output by each engine.
Finally, we set up a custom targeting rule that considered the customer and the rule engine name.
Initial: Kubernetes
Once the instrumentation and feature flags were functional, we began setting up the necessary building blocks in Kubernetes.
When setting up pipelines, I try to get all the pieces connected first and then iterate through the process of adding the necessary functionality.
So, we set up a Deployment in Kubernetes. A Deployment encapsulates all of the necessary configuration to run a container. To simplify the initial setup, we had the application connect to the Detections API service on startup to retrieve detection content. This microservice abstracts our detection-content-as-code, giving programmatic access to the current tip of the main branch of development.
Note that we configured the LaunchDarkly feature flags before turning on the deployment.
The first flag controlled whether or not this instance of the detection engine would process an incoming event from Kafka. This flag allowed us to start with a trickle of data in the new environment, and gradually ramp up the volume to test processing load in Kubernetes.
The second flag controlled whether this version of Josie would publish the results of the analysts’ rules to the Expel Workbench. This allowed us to work through potential issues encountered while getting the application to function in the new environment, without fear of breaking the live pipeline and polluting analyst workflow.
You can see the diagram I created to help visualize the workflow below.
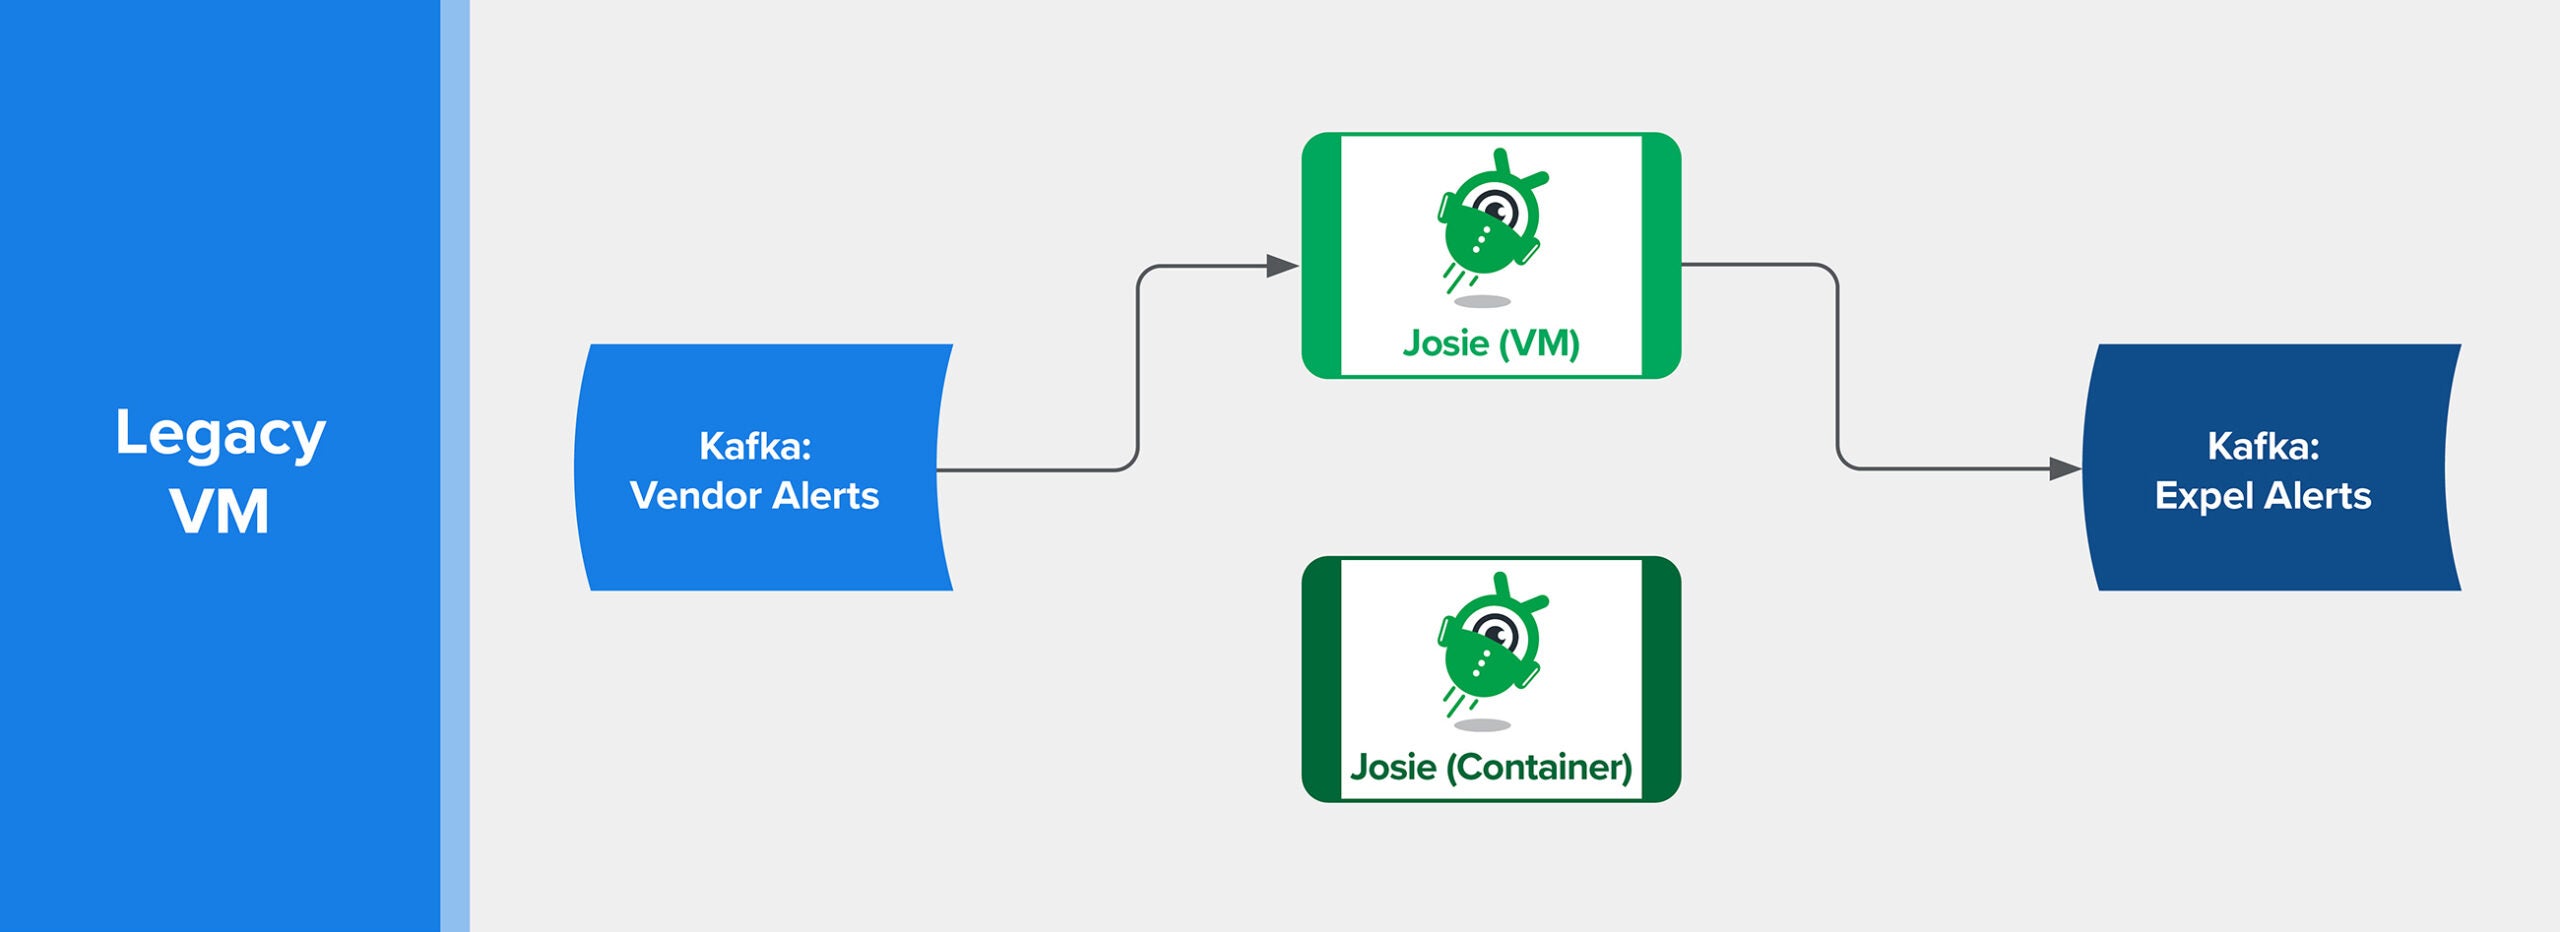
LaunchDarkly feature flags control flow
Load Testing
Once the new Deployment was functional inside Kubernetes, we began a round of load testing. This was critical to understand the base performance differences between the execution environments.
We performed the load testing by first enabling ingress for all data into the new detection engine, but kept egress turned off.
We then rewound the application’s offset in Kafka. The data arrived in the rule engine and performed processing, but any output would be dropped on the floor. The processing generated the same level of metric data that the live system did, so we could compare key metrics such as overall evaluation time, CPU usage and memory usage.
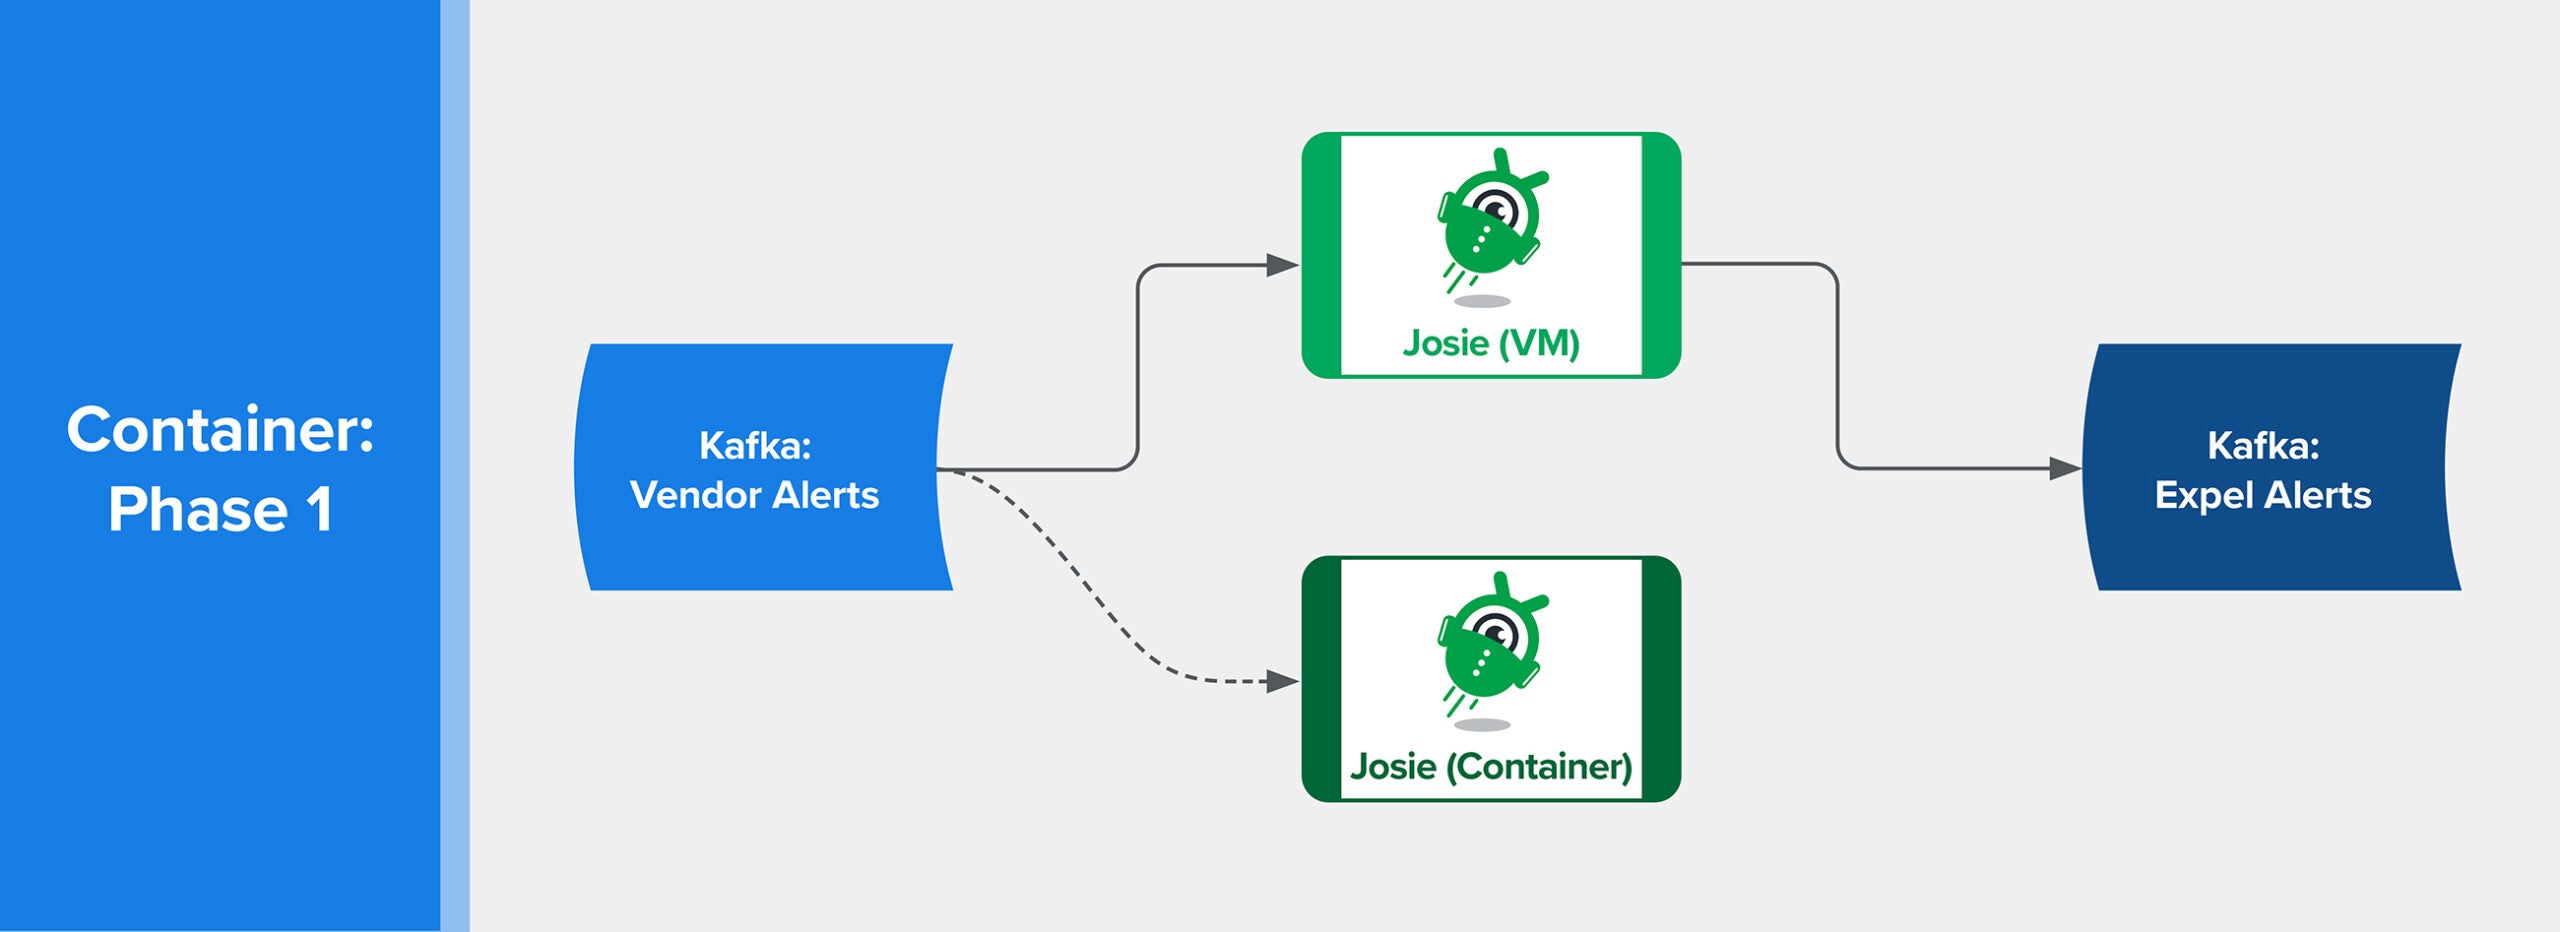
LaunchDarkly feature flags control flow
Output Validation
While we iterated through the load test, we also tested the data that was output by the new system.
We pulled this off by tweaking the feature flag targeting rule to allow egress for the new detection engine for a specific customer. We chose an internal customer so that we could see the output in the Expel Workbench, but not disrupt our analysts.
We triggered alerts for this customer then checked to see if each alert was duplicated, and if the content of each duplicated alert was identical.
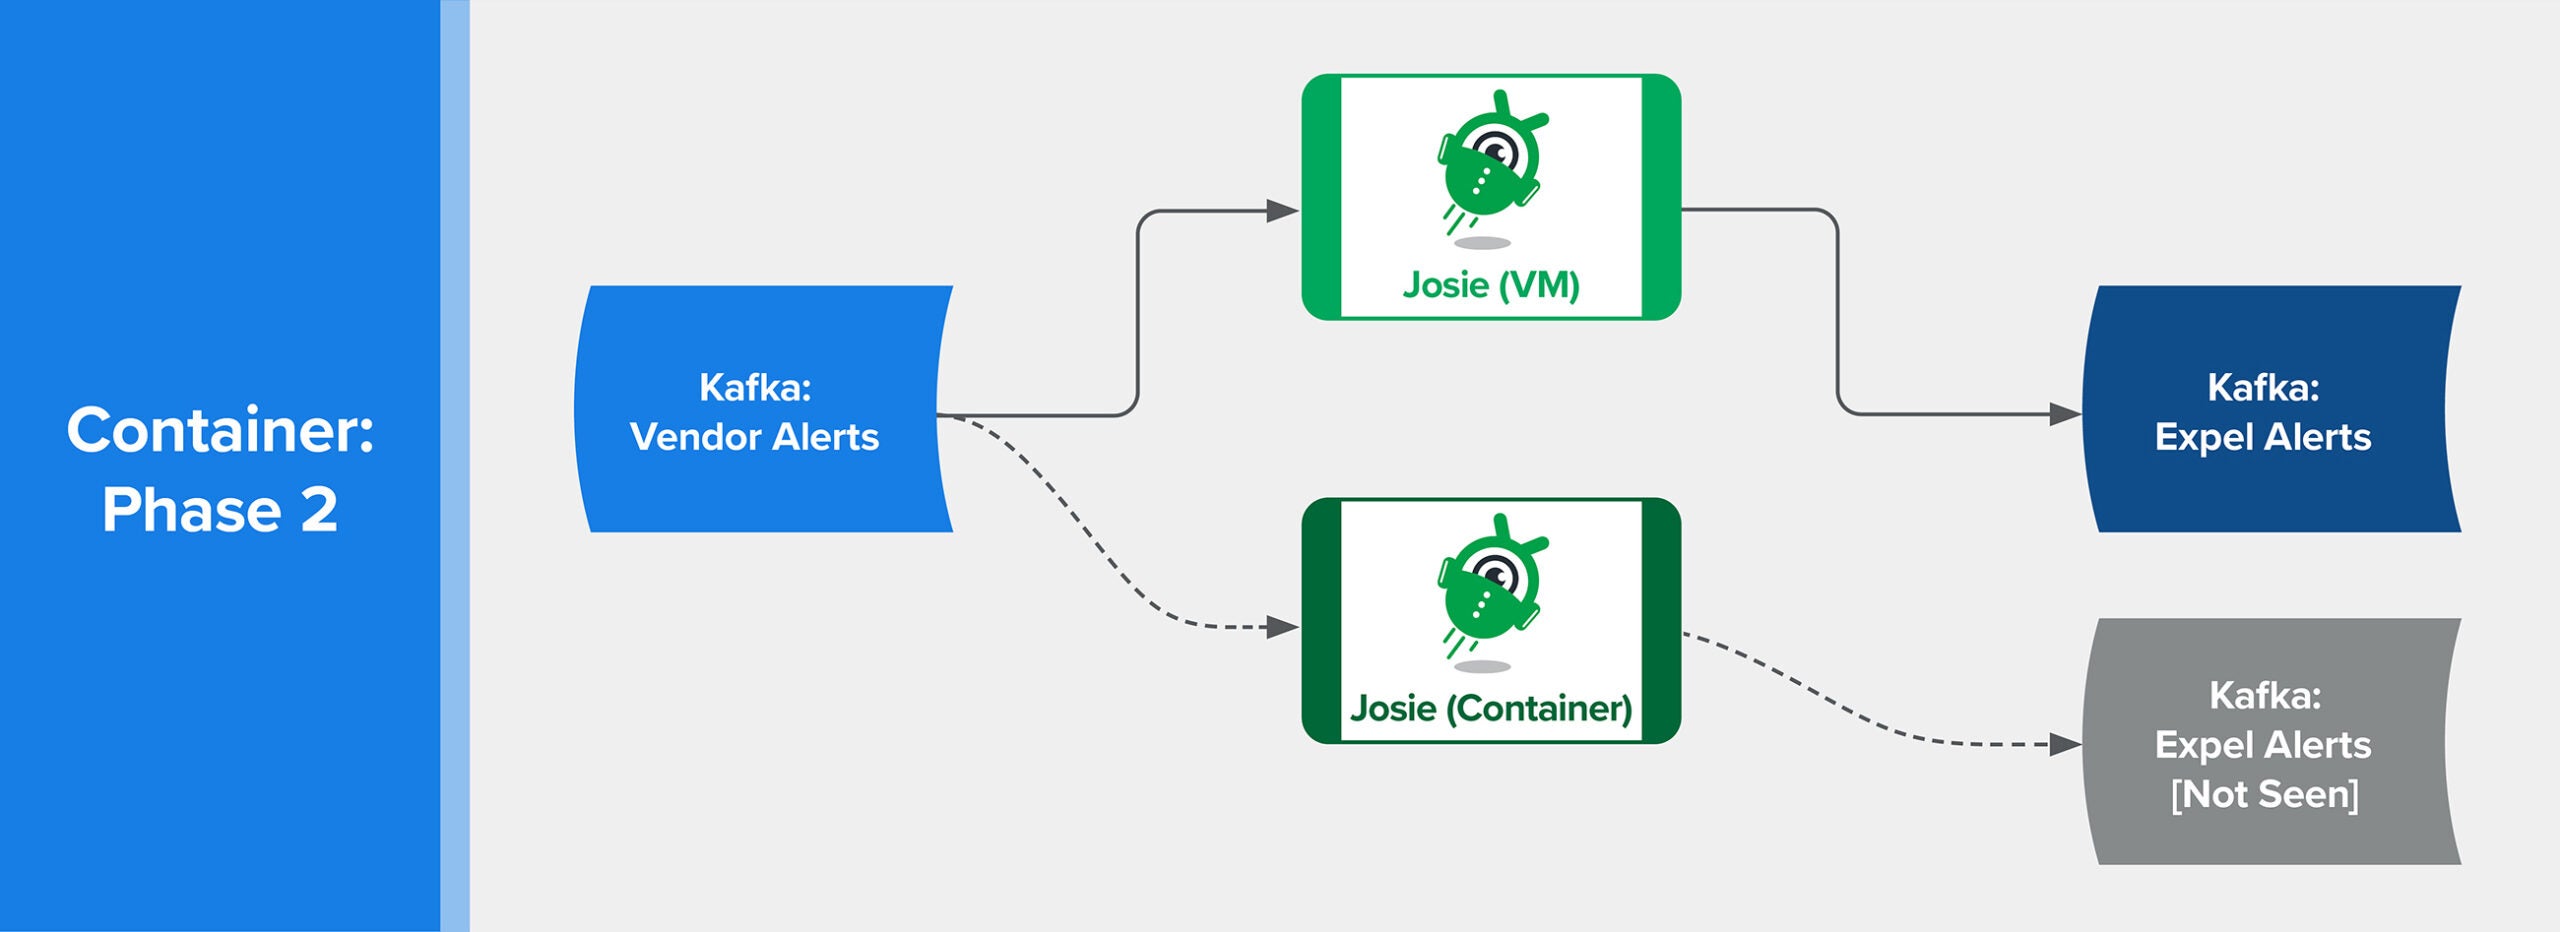
LaunchDarkly feature flags control flow
Rule Delivery
Once we were sure the new execution environment was capable of processing the load as well as generating the same output, we began to tackle the thorny problem of how to deliver the rule content.
At Expel, our belief in infrastructure-as-code extends to the rules our SOC analysts write to detect malicious activity. The detection content is managed in GitHub, where changes go through a pull request and review cycle. Each detection has unit tests that run through CircleCI on every commit.
Getting detection content from GitHub to the execution environment is tricky. The body of rules is constantly changing, and the running rule engine needs to respond to those changes as quickly as possible.
Previously, when a pull request was merged, delivering the updated rule content involved kicking off an Ansible job that would perform a series of operations in the VM, and then restart processes to pick up the change.
The entire process from pull request merge to going live could take as long as 15 minutes. Not only that, there wasn’t much visibility into when those operations failed.
That’s when we asked: Could Kubernetes help us improve this process?
The team wasn’t happy with the direct network connection on startup behavior, mainly because it introduced a point of failure and rule changes weren’t captured after startup.
After talking with our site reliability engineering (SRE) team, we decided that the Detections API should store a copy of the rule’s content in a Kubernetes configmap.
We then updated the Kubernetes Deployment to read the ConfigMap contents on startup. This decoupled the application from the network so that service failures in Detections API would not break the rule engine.
But this introduced the possibility of a few other failure modes. If the saved rule content was not getting updated correctly, the running engine could be stuck running stale versions of the rule definitions. One possible cause of this is the size limit on ConfigMaps.
Fortunately, addressing these possible failure modes was fairly straight forward. We used monitors in DataDog.
We made use of a reloader controller to react to changes in the ConfigMap. This controller listens for changes in the ConfigMap and triggers an update to the Deployment. When Kubernetes sees this change in the Deployment, it initiates a rolling update. This process ensures that the new pods start successfully, then spins down the old pods.
With both of these changes in place, we arrived at a solution that simplified the operation of the system and allowed it to react to changes in rule content faster than the original implementation.
Below is a diagram of the entire process.
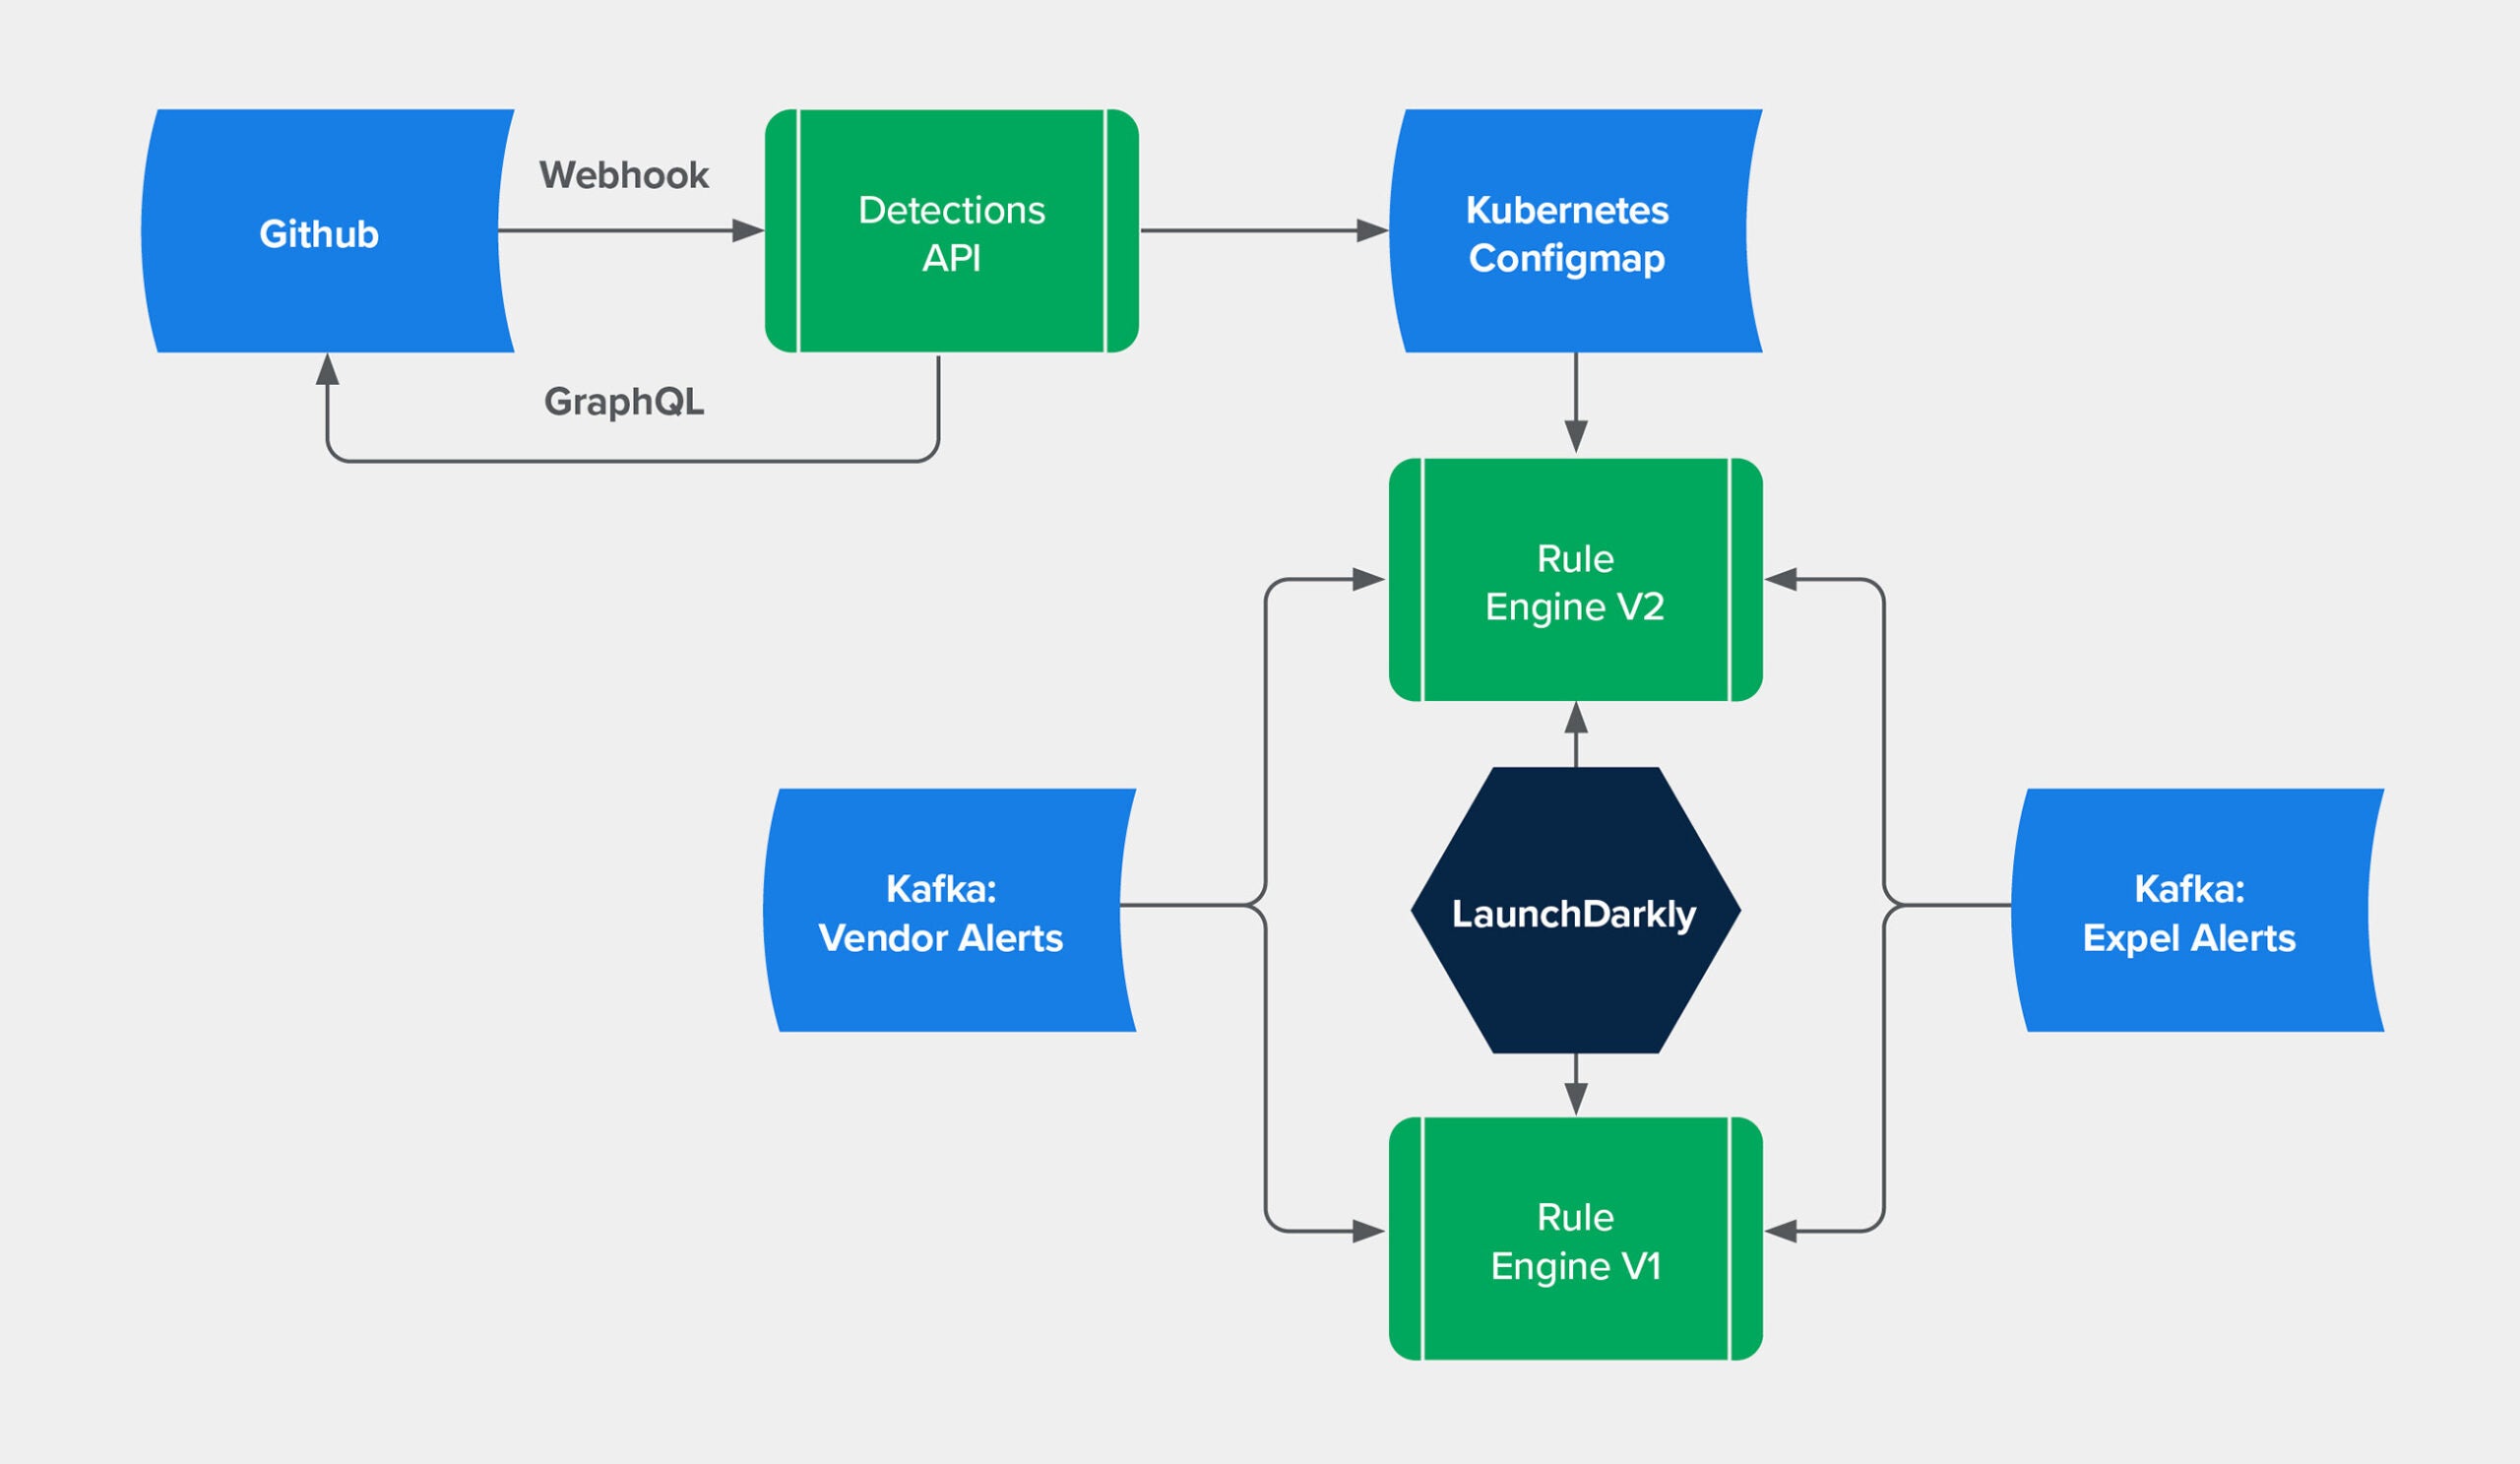
Expel containerized rule engine
Live Migration
With the new Deployment performing well and responding to rule changes, we were ready to shift live processing from the old system to the new.
We decided to do a phased rollout. We started with a small subset of our customer base, turning egress off in the old implementation and on in the new.
We allowed the system to run for a couple of days, and then slowly increased the number of customers routing to the new system.
After a few more days, we shifted all customer egress to the new pipeline and turned off egress on the old one. We kept the old system running in parallel so that if we encountered any discrepancies or problems, we could easily flip back to it.
After letting both run in parallel for a week, we decommissioned the legacy VM system.
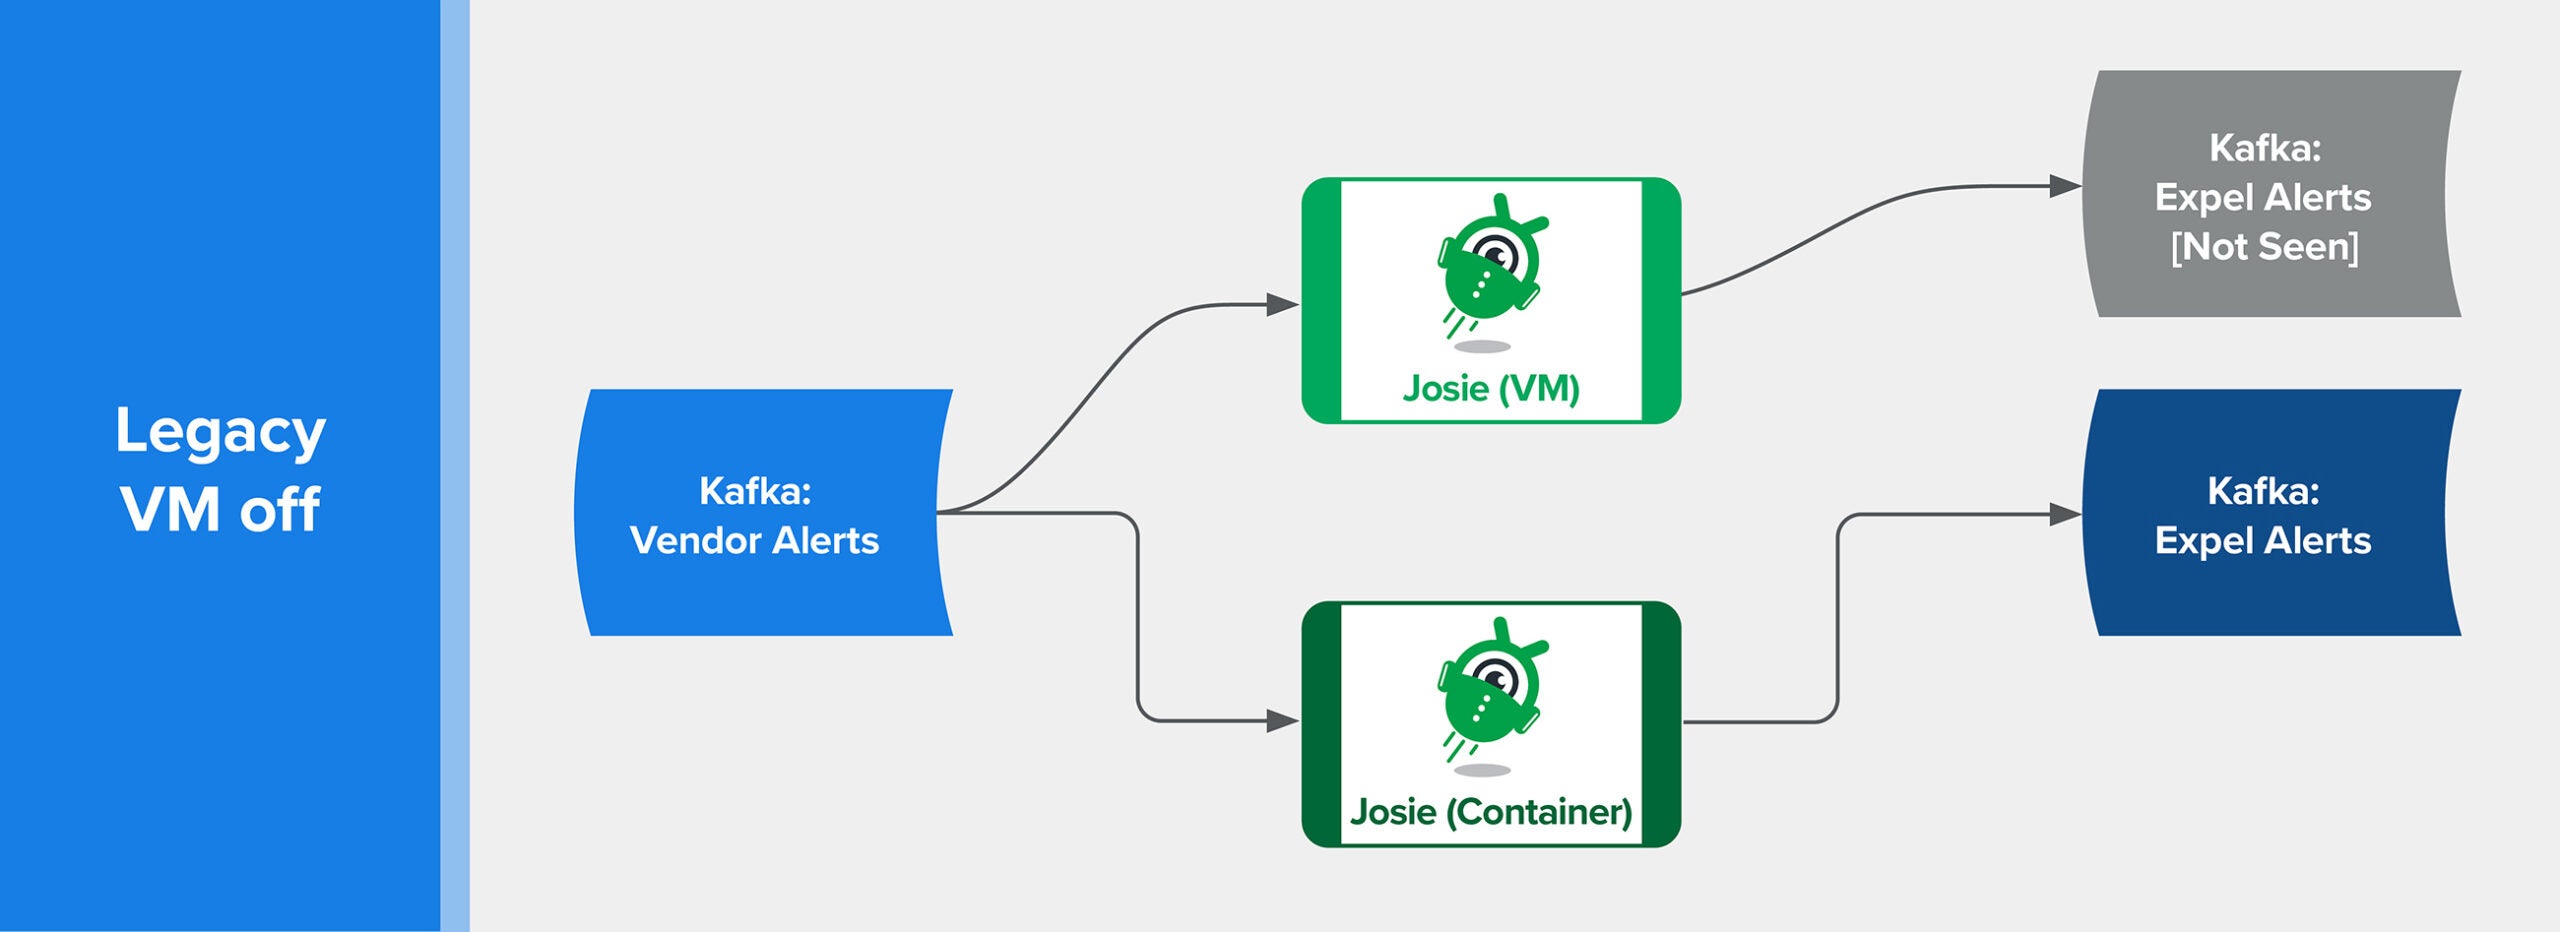
LaunchDarkly feature flags control flow
What this means for developers
Large-scale change to a critical business component is a daunting task. Throughout the process, we made sure to keep both the SOC and leadership in the loop.
You’ve probably seen us mention the importance of communication a few times.
Regular communication during each phase, especially the planning phases, was critical. We needed to learn about the key dashboards and monitors in play.
This also helped us mitigate the risk of having to answer to an angry SOC.
Here are some tips based the lessons we learned along the way:
- LaunchDarkly provides a rich set of feature flags. While it provides a richer feature set than what we took advantage of, we were able to deploy code live but control execution at a very granular level through the use of feature flags. Our main goal here was to know in advance which subset of customers would be processed by which engine so that their associated engagement managers could be prepared for questions.
- Adopt observability. Our investment in being driven by metrics paid dividends here. The existing DataDog dashboards were comprehensive and we easily compared both systems simultaneously. We also leveraged the existing corpus of monitors by adjusting their targets to take an additional label into account.
- Don’t overlook the primitives available in Kubernetes. They gave us the flexibility to respond to content changes at a much faster pace, and with greater visibility. While Kubernetes does support live reloading of configmap content, the current iteration of the engine doesn’t take advantage of it. Our plan was to dynamically reload rule content in the running pod, instead of restarting on change. This alleviated hot-spots around waiting for Kafka partition ownership to settle, further decreasing the time it took for detection content to go live.
I hope that this post helped give you some ideas and maybe even saved you some time problem solving.
Want to learn more about security operations platform? Check out the Expel Workbench™ page to read on.


